Data analysis and Reading are two of my key interest areas. I used to keep a track of the books that I read on Goodreads and would check the stats page every time I finished a book just to see the graph change.
But, I was not very pleased with the limited data points that Goodreads provided on the stats page – no. of pages and no. of books read in a year (at least that was the case in 2018, they may have added more options now).
So, I decided to track my reading activity in a Google Sheet and draw insights from that. I started this in May 2018, and have religiously tracked my reading activity ever since. Over time I have also made a lot of improvements in my template.
This is how I track my reading.
1) Books Metadata
The first tab in the Google Sheet is called Books Metadata. I record a few details about every book that I purchase – author, genre, language, pages etc.
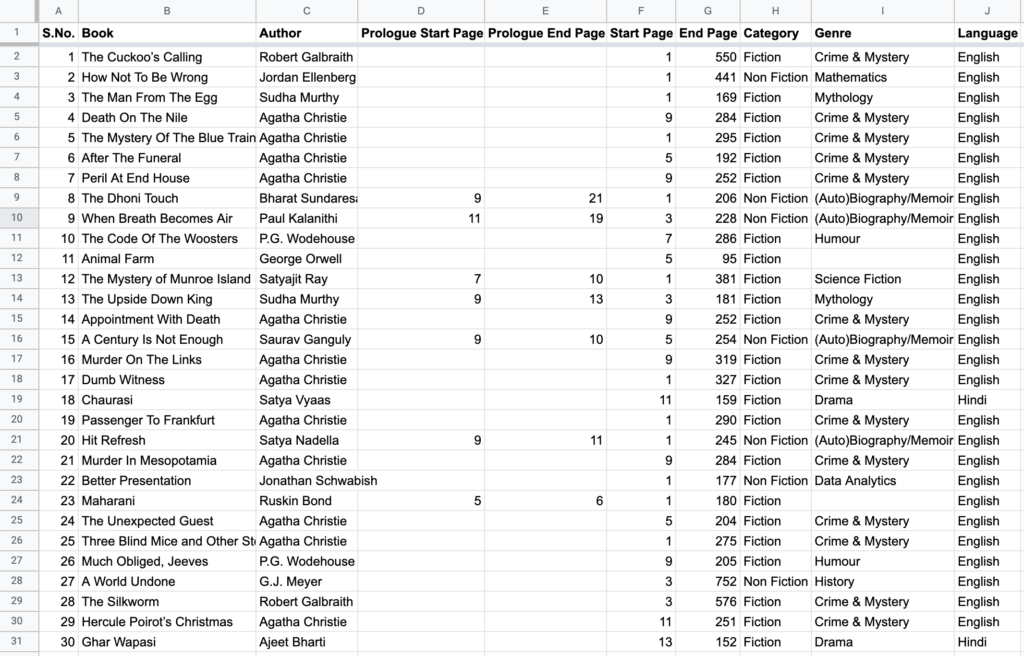
I add the start page number and end page number because I wanted to have a more granular level of detail. But you can just record the total number of pages instead.
This sheet has one row per book.
2) Raw Data
The next tab is called Raw Data. This is the main tab where I keep a record of my reading activity.
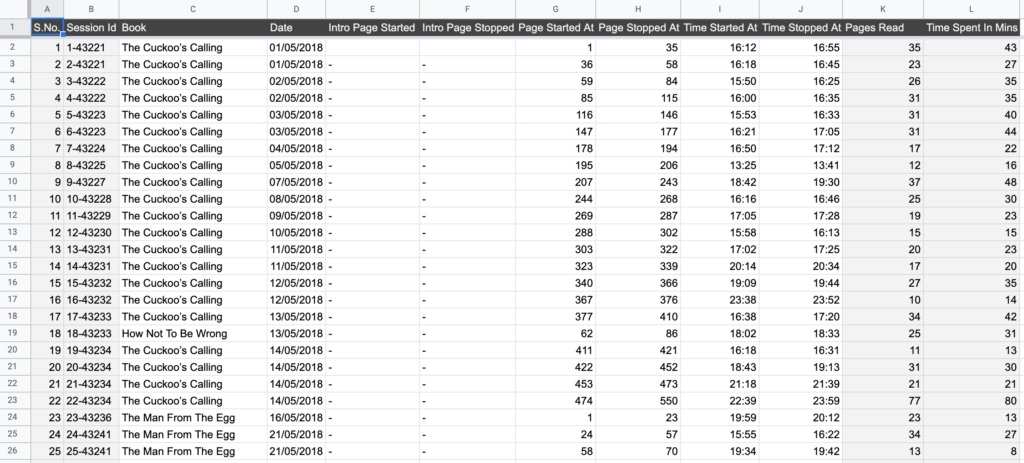
When I pick a book to read, I first open the Sheets app on my phone and record the following details in this tab:
- Name of the book
- Current Date
- Page number where I’m starting from
- The time when I started
- Page number where I stopped
- The time when I stopped
The columns that are in grey color are auto-populated.
As you can see in the screenshot above, one book can have multiple entries.
3) Book Metrics
This tab is where all the calculations happen. This is all formula driven – no manual effort is required here.
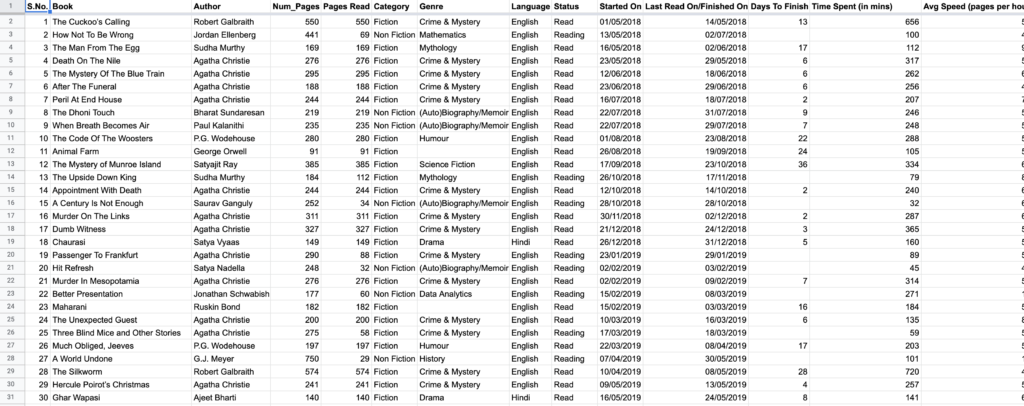
I calculate a lot of things in this sheet – the current status of book (read, reading, not started), how many days it took to finish, how much time did I spend reading a book, how many sittings did I need to finish a book, my average reading speed etc
As I mentioned above, this is all formula-driven. There is one row of data per book.
4) Reading Habit
Using the information captured in the previous tab, I create this visualization to see my reading activity over the year.
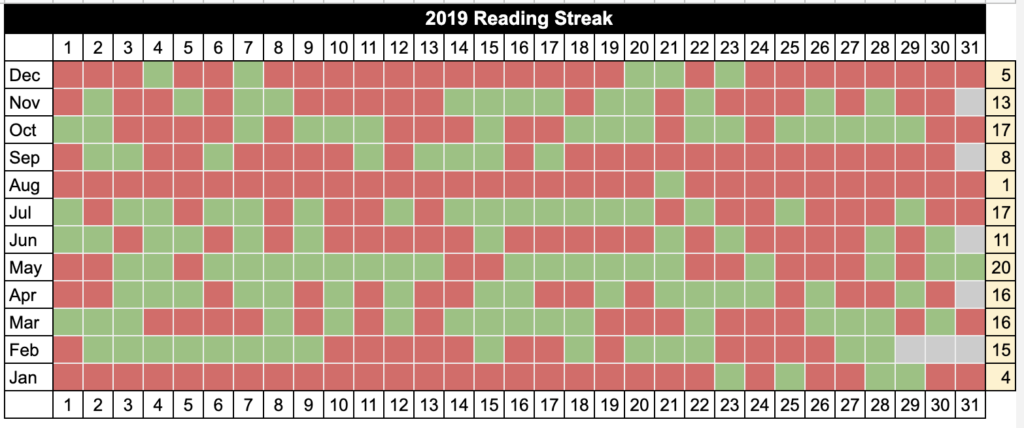
The green cells depict the day I read and the red one denotes the days I didn’t read. The column in the right gives the number of days in a month I read a book.
This again is completely formula-driven + conditional formatting.
5) Summary Tab
The last tab is the summary tab for the year. Here I visualize a few high-level details from the Metrics tab.
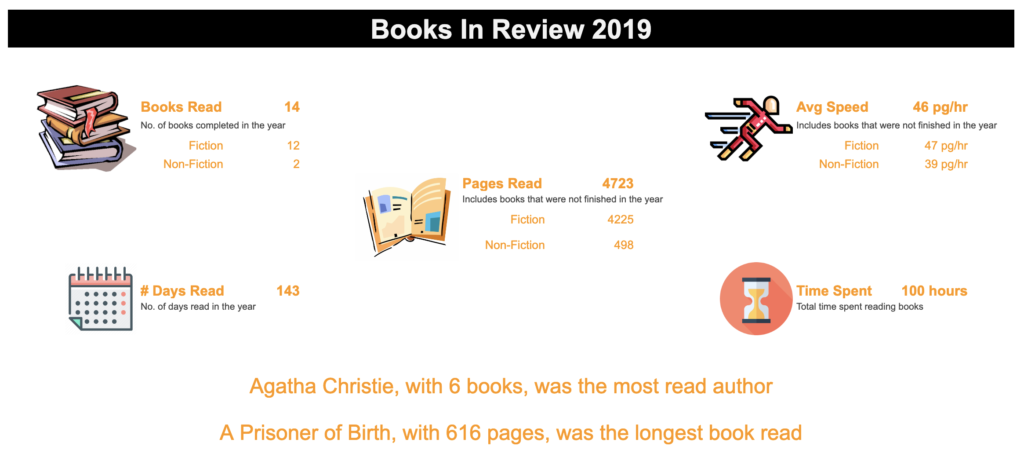
At the end of every year, I just make a copy of this tab and change the year number. That gives me the stats for that year.
You can check my stats from 2019 here.
This may look like a lot of work to some. I have been told by a few that reading should be for pleasure and by tracking these details I am making it look like a task. To them, I quote Mark Twain:
Work consists of whatever a body is obliged to do. Play consists of whatever a body is not obliged to do.
For me, this is play! 🙂
 Subscribe
I write on various topics such as productivity, tech, books, personal finance, and more. To stay updated, choose either (or both) of the options below:
Get Real-Time Alerts
Stay in the loop with real-time alerts. Join my WhatsApp channel for instant notifications on new articles, captivating book snippets, noteworthy web finds, and more. Experience it as it happens.
Monthly Email Digest
Prefer a monthly roundup? Subscribe to the Email Newsletter to receive a neatly organized digest at the end of each month. Explore everything I wrote, handpicked web gems, and more – delivered to your inbox in a well-packaged newsletter format.