December is the month when I usually take stock of various aspects of my life and plan for the year ahead. Personal finance is one such area of focus. For this I rely on a semi-automated Google Sheets dashboard that I’ve painstakingly built and refined over the years for my use case.
During this year’s review, I realized I’ve accumulated 15 years’ worth of data in my Google Sheet. The data nerd in me couldn’t resist digging into it to see if I can find some interesting insights or uncover some fun facts.
Here’s what I discovered.
The Firsts
I opened my demat account in 2009 during my final semester of college. My first investment was made in Jan 2009 – a few shares of Wipro and Reliance Petroleum bought with my pocket money. It was a purely random decision to purchase those stocks – I just wanted to kick start my investment journey. Reliance Petroleum later merged into Reliance Industries offering 1 share of Reliance Industries for every 16 shares of Reliance Petroleum. I still hold these shares in my portfolio.
I also tried my luck in trading around the same time. A real-time stock market simulator, called KheloStocks (if memory serves me right), was quite popular then and I made loads of fake money on it and thus convinced myself that I was ready for real-world trading. But the panic that sets in when you see your pocket money vanish in a heartbeat is real, and I quit trading as quickly as I started. Amusingly, some of the companies I traded in are no longer listed on the stock exchange!
My first Mutual Fund purchase was in April 2010. I picked a random equity fund, held it for ten months, and exited with a small profit. Between April 2010 and July 2011, I experimented with a few more funds, none of which I held for long. In fact, the shortest duration I held an equity fund was just 91 days!
Beginning My Investment Journey
I only got serious about investing around 2015. By then, I had adopted a more disciplined approach – researching thoroughly, staying invested through market downturns, and focusing on long-term goals.
I initially started with regular mutual funds, purchasing them through Scripbox. Over time, as I gained experience and confidence, I switched entirely to direct mutual funds, which I now manage through Kuvera.
To better understand how my investment journey has evolved, I plotted a graph showing the cumulative value of my net investment over time (net investment = total investments made – total investments exited). Note that this graph reflects the total amount I’ve invested, and not the market value of these investments.
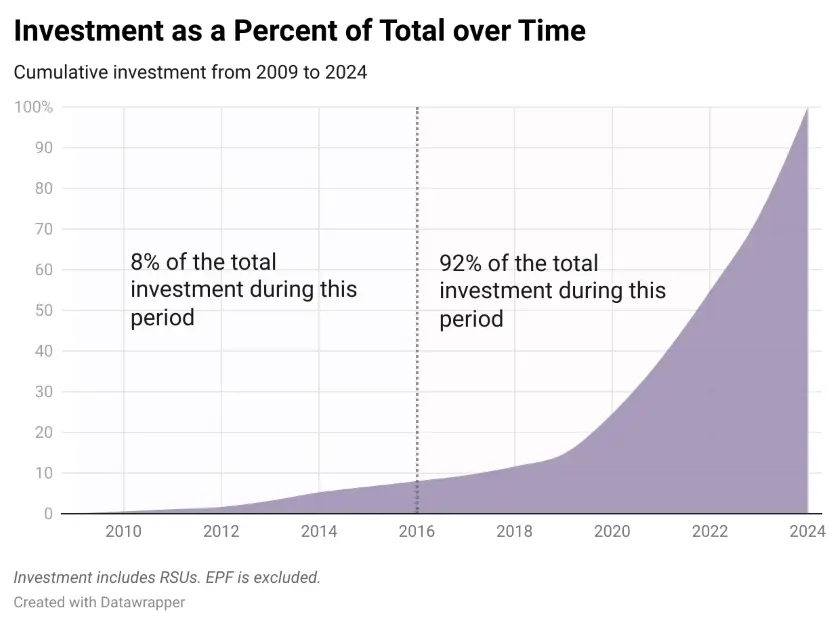
An interesting observation – investments made in the first half of my career (until 2016) account for only ~8% of my total investment to date (~6% when I excluded RSUs).
Was this due to poor investment habits or simply lower income during the early stages of my career (relative to my income in the later years)?
Investment-to-Income Comparison
To answer that, I analyzed my investment-to-income ratio over time.
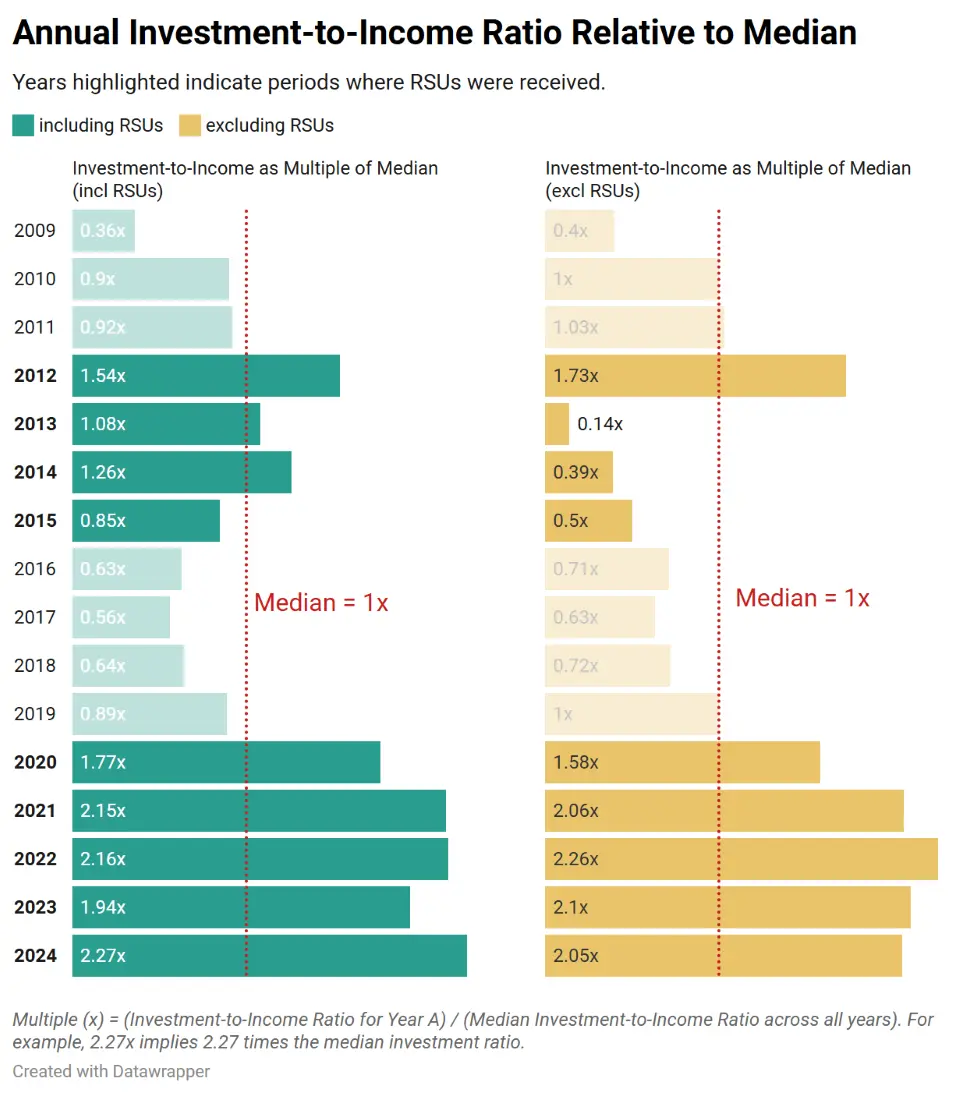
For privacy, I averaged the percentage of income invested annually and calculated how each year’s Investment-to-Income ratio stands relative to the average.
Multiple (x) = (Investment-to-Income Ratio for Year A) / (Median Investment-to-Income Ratio)The chart on the left includes RSUs while the one on the right excludes any RSUs as well as any investments that happened due to the funds received from the sale of RSUs.
Three things that stand out:
1. In the last five years (2020–2024), my investment-to-income ratio has consistently surpassed the median. Interestingly, this coincides with the time I joined Uber.
2. During the early phase of my career (2012–2014), RSUs significantly boosted my investment-to-income ratio, pushing it above the median.
3. In recent years (2020 onwards), even after excluding RSUs, the ratio remains above average.
When I think of the factors driving this uptick in recent years, several reasons come to mind (in no particular order):
- I joined a company (Uber) that pays well, which has naturally boosted my capacity to invest.
- While my family calls me a spendthrift, my spending habits haven’t changed drastically with an increase in income – I rarely feel tempted to purchase latest gadgets, upgrade to a new phone every year, or shop impulsively.
- Over the years, I’ve developed a keen interest in personal finance. Reading extensively on the subject has not only expanded my knowledge but also instilled discipline in my investment approach.
- I don’t have any EMIs at the moment. I live in rented accommodation and don’t plan to purchase a home anytime soon until I’m certain about where I want to settle.
That said, I know that I might not be able to sustain my current investment-to-income ratio in the long run. As responsibilities grow, my investment rate will likely taper off. For now, I’ll enjoy making hay while the sun shines.
How My Investments Have Fared
Unfortunately, I didn’t maintain a yearly record of my investment valuations, so I can’t track their growth over time. I only have the latest valuations, which I have used to compare the portfolio distribution and returns across the different categories I’m invested in.
Portfolio Snapshot
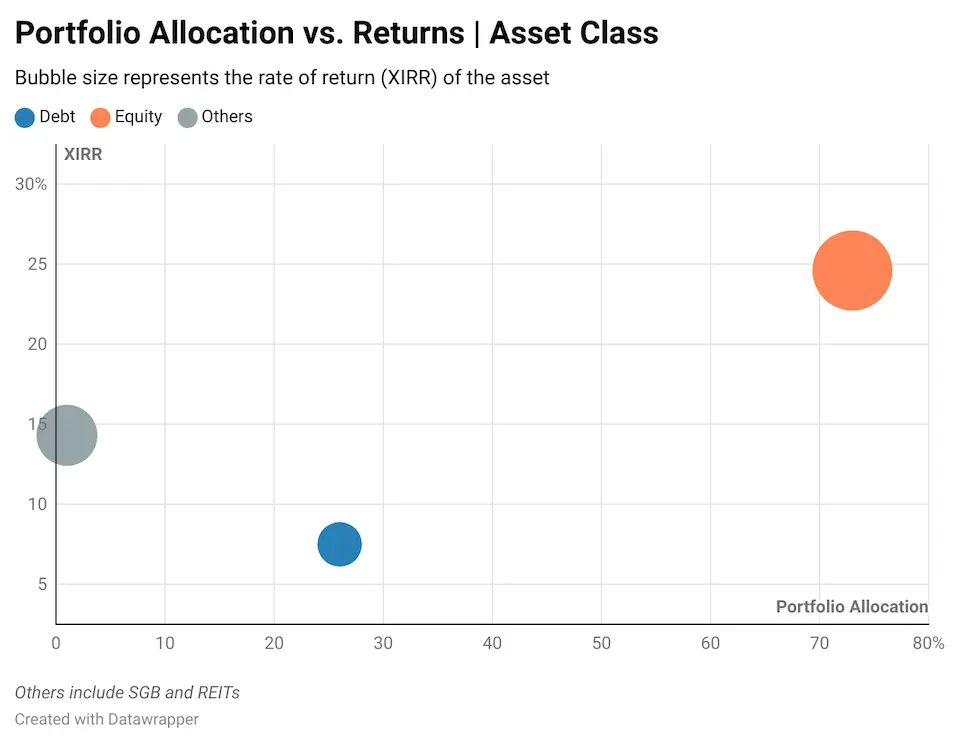
Nothing worth noting here. Over 70% of my allocation is in equity – which makes sense because most of the goals that I am investing for our years away. The XIRR of my equity portfolio is at a healthy 25%, while that of my debt portfolio is ~7.5%.
Breaking Down the Asset Classes
Going a level deeper, here is what the breakdown of these asset classes look like:
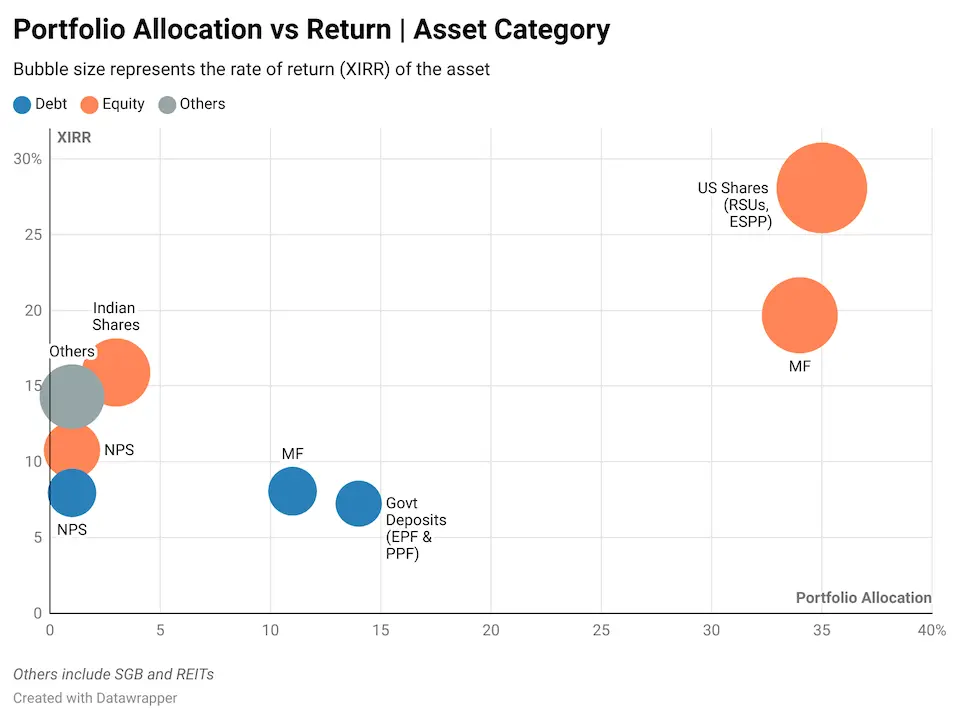
A significant chunk of my equity portfolio is tied to Mutual Funds and US shares. The US shares are the ones I received from my employers; I don’t invest in US equity directly due to the taxation complexities involved, which I’ve touched upon in this article. While US shares have delivered the best returns, I’ve been gradually reducing this exposure, to reduce concentration risk. I generally reallocate these funds to mutual funds, which have also given decent returns at ~20% XIRR.
Indian shares make up less than 5% of my portfolio. My direct equity portfolio hasn’t outperformed my mutual fund portfolio, which doesn’t surprise me. I neither have the time nor the will to research and monitor stocks. But to scratch the itch for purchasing direct stocks, I stick to stable large cap companies that offer consistent returns.
A Closer Look at Equity Mutual Funds
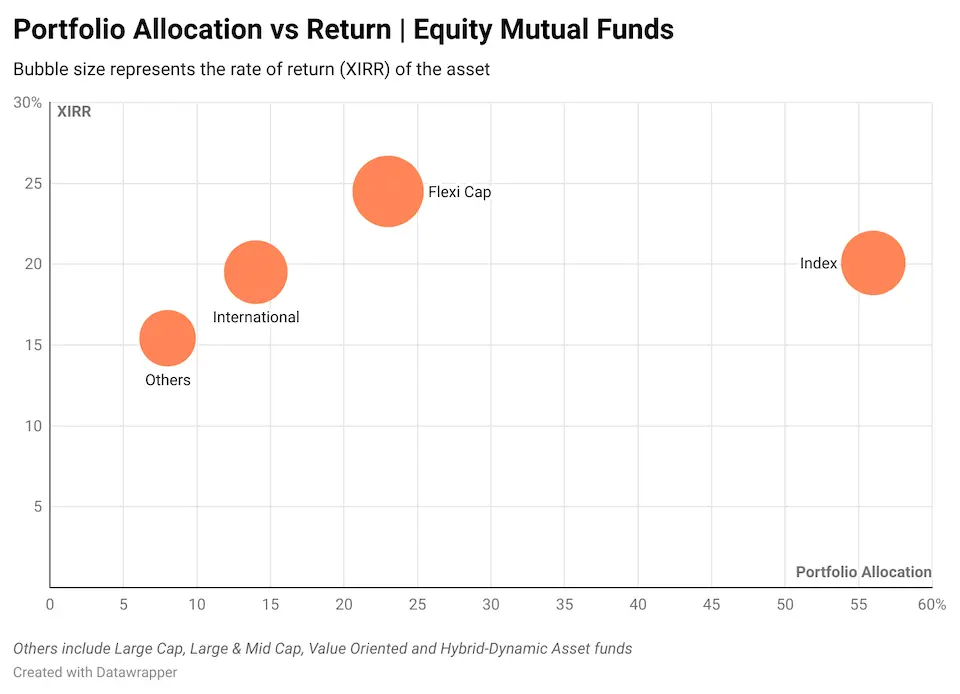
As is evident from the chart above, I’m an index investor. Most of my current SIPs are in Index funds, followed by Flexi Cap funds. The rest of my mutual fund portfolio (~20%) consists of older investments that I’m holding onto for now, but I may consolidate these into index and flexi-cap funds over time. I prefer simplicity and my index and flexicap funds have given me steady returns over the years without the stress of chasing the next “hot” fund.
Looking back, I can clearly see the financial mistakes I made in the early years of my career. As I shared in my article about my career journey, I almost turned down an offer from Facebook at that time! It’s only by God’s grace that those financial missteps didn’t come back to haunt me and I was able to course-correct while I still had time on my side. It’s humbling to see how financially savvy the younger generation entering the workforce today is.
Over the years, I’ve experimented with various investment options but have now learned the value of simplicity. I no longer chase aggressive returns – there is no end to that race. My focus is on meeting my financial goals with instruments that align with that – even an FD could work if it suits a specific need. I’ve come to appreciate a simple investment strategy that quietly works in the background, allowing me to sit back and focus on things that truly matter – my work and my life.
Thanks for reading. Please leave a comment with your thoughts. And share this blog with whoever you think might like it.
Go Deeper on Data, Finance, and Productivity
If you enjoyed this article, you’ll love my newsletter, Compound Knowledge, where I share actionable ideas and the best resources I’ve found to help you uplevel your skills in data, finance, and productivity. It’s concise, valuable, and free.
Join the inner circle of readers and get insights directly in your inbox.
Photo Credit:
- Feature Image: by Chris Lawtonon Unsplash


