I’ve been managing teams for over five years now, and while I enjoy the responsibilities that come with it, one side effect of this is that you gradually lose touch with your own craft.
Recently, I decided to get back in touch with the grind by taking on small projects to work on myself. This shift has been a welcome change from the usual managerial duties that often pull you away from core work. It’s also been challenging because you tend to forget some basic things when you are out of touch for long. But the joy of researching and figuring things out on your own is incomparable.
Now, the purpose of this article is twofold – one, to document my learnings so that if I encounter similar problems in the future, I won’t have to rely solely on memory. Second, if someone else finds themselves in the same boat, they might find this useful too.
Note: If you use Tableau regularly, there might not be much of value for you here.
Visualizing Survey Data
Recently, we sent out a survey to stakeholders our team works with to identify what’s working well and what areas need improvement. We used a Google Form, asking respondents to rate our work on a Likert Scale (1 to 5) across several themes. The responses were linked to the specific pod (a group of a Program Manager and a few analysts) that each stakeholder collaborates with.
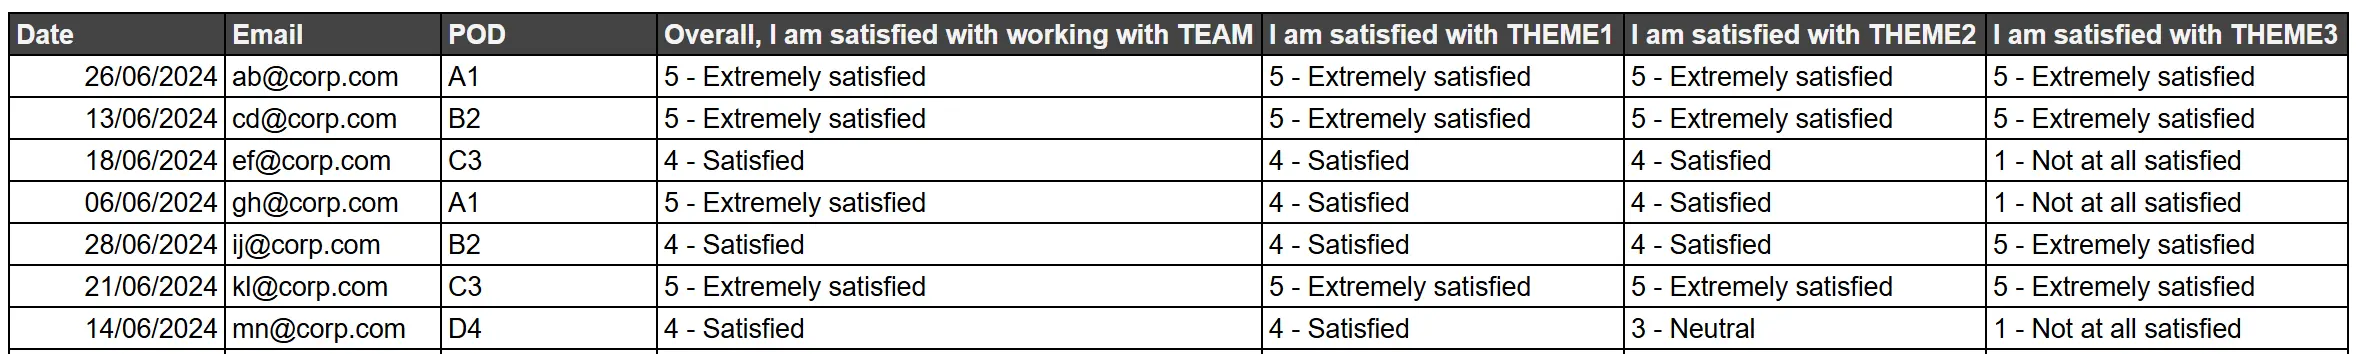
Here is a simplified version of the questions we asked:
- Overall, I am satisfied with working with the team.
- I am satisfied with [THEME 1]
- I am satisfied with [THEME 2]
- I am satisfied with [THEME 3]
The resulting Google Sheet looked something like this (dummy data):
After collecting the responses, we looked at the average score for each theme and pod to discuss our learnings and action items. This is how the output looked:
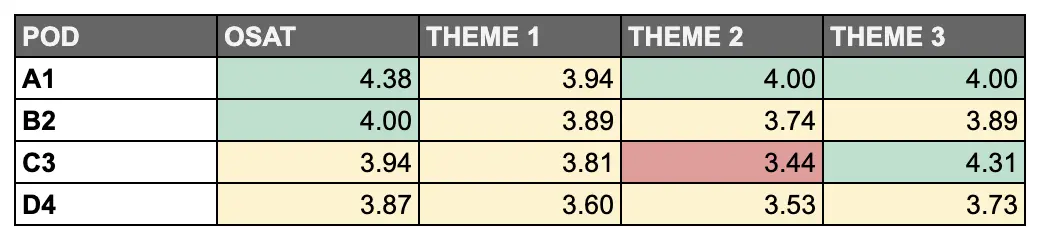
While the exercise is already over, I wanted to see if there was a better way to visualize the results of such a survey which could also provide more meaningful insights. Simply looking at averages can be misleading. Two pods could have the same average score, but one might have mostly neutral ratings, while another could have a mix of high and low scores. Both would look the same based on the average, but their actual performance could be quite different.
So, after some brainstorming, I built a Tableau visualization to analyze the survey data more effectively.
This dashboard provides a score summary (similar to google sheet version) and also shows the distribution of responses, allowing for better decision-making. For instance, while the average score for Theme 3 may appear higher than Theme 2, the breakdown shows significant variation in stakeholder satisfaction—a clear signal to dig deeper.
Steps To Build This Dashboard
Working in Tableau can get frustrating, especially if you don’t use it regularly. Some features that seem obvious are not as straightforward to implement.
Here’s a quick reference on how I built the dashboard, both for my future self and for anyone else working on a similar problem.
- Clean & Format the Data
- Create the Score Summary
- Create the Tiles
- Create the Likert Chart
- Formatting Hacks
The data was stored in a Google Sheet, and I used Tableau Public 2024.2 for the visualization.
Step 1: Clean and Format the Data to Use
There were two minor challenges:
- Text Responses: Ratings like “5 – Extremely satisfied” need to be converted into numeric values to calculate scores.
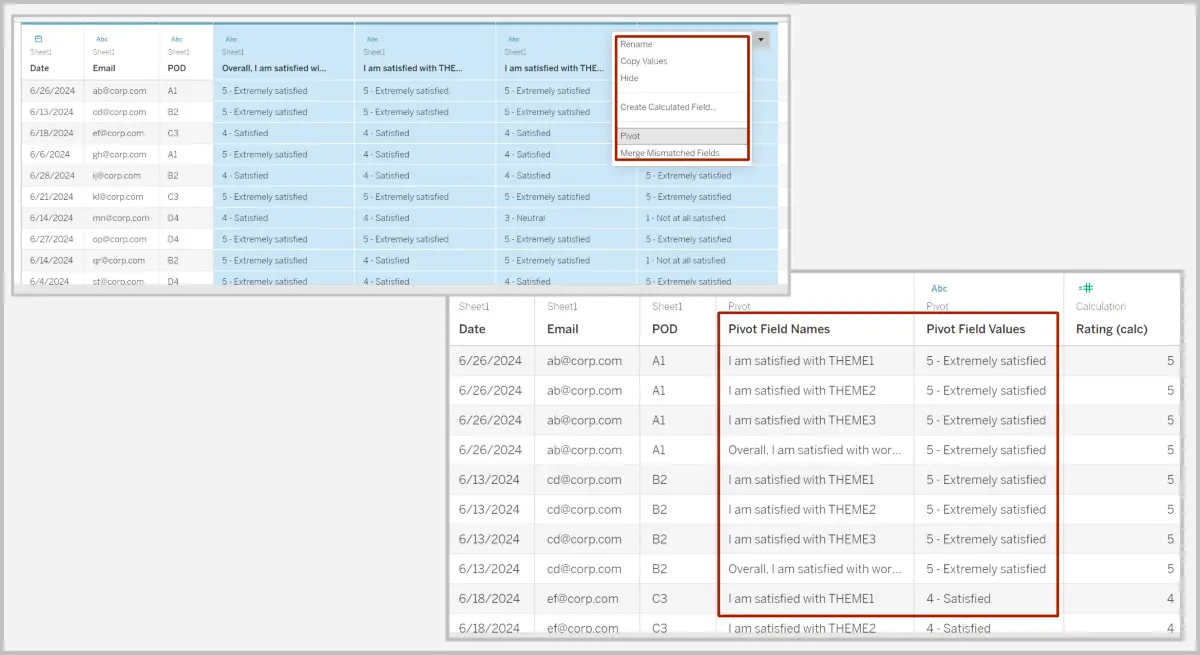
- Column Pivoting: To create the Likert chart, the column names (e.g., “I’m satisfied with Theme 1”) had to be transformed into values in a single column, with corresponding responses in another.
Although I was tempted to do this transformation in Google Sheets, Tableau handles this fairly easily.
After connecting the Google Sheet to Tableau, I created a calculated field “Rating (calc)” using the following formula:
IF [Pivot Field Values] = '5 - Extremely satisfied' then 5
ELSEIF [Pivot Field Values] = '4 - Satisfied' then 4
ELSEIF [Pivot Field Values] = '3 - Neutral' then 3
ELSEIF [Pivot Field Values] = '2 - Slightly unsatisfied' then 2
ELSEIF [Pivot Field Values] = '1 - Not at all satisfied' then 1
END
For the pivoting issue, go to DataSource, select the columns, and convert to pivot.
With that we have the data ready for the visualization.
Step 2a: Create the Score Summary
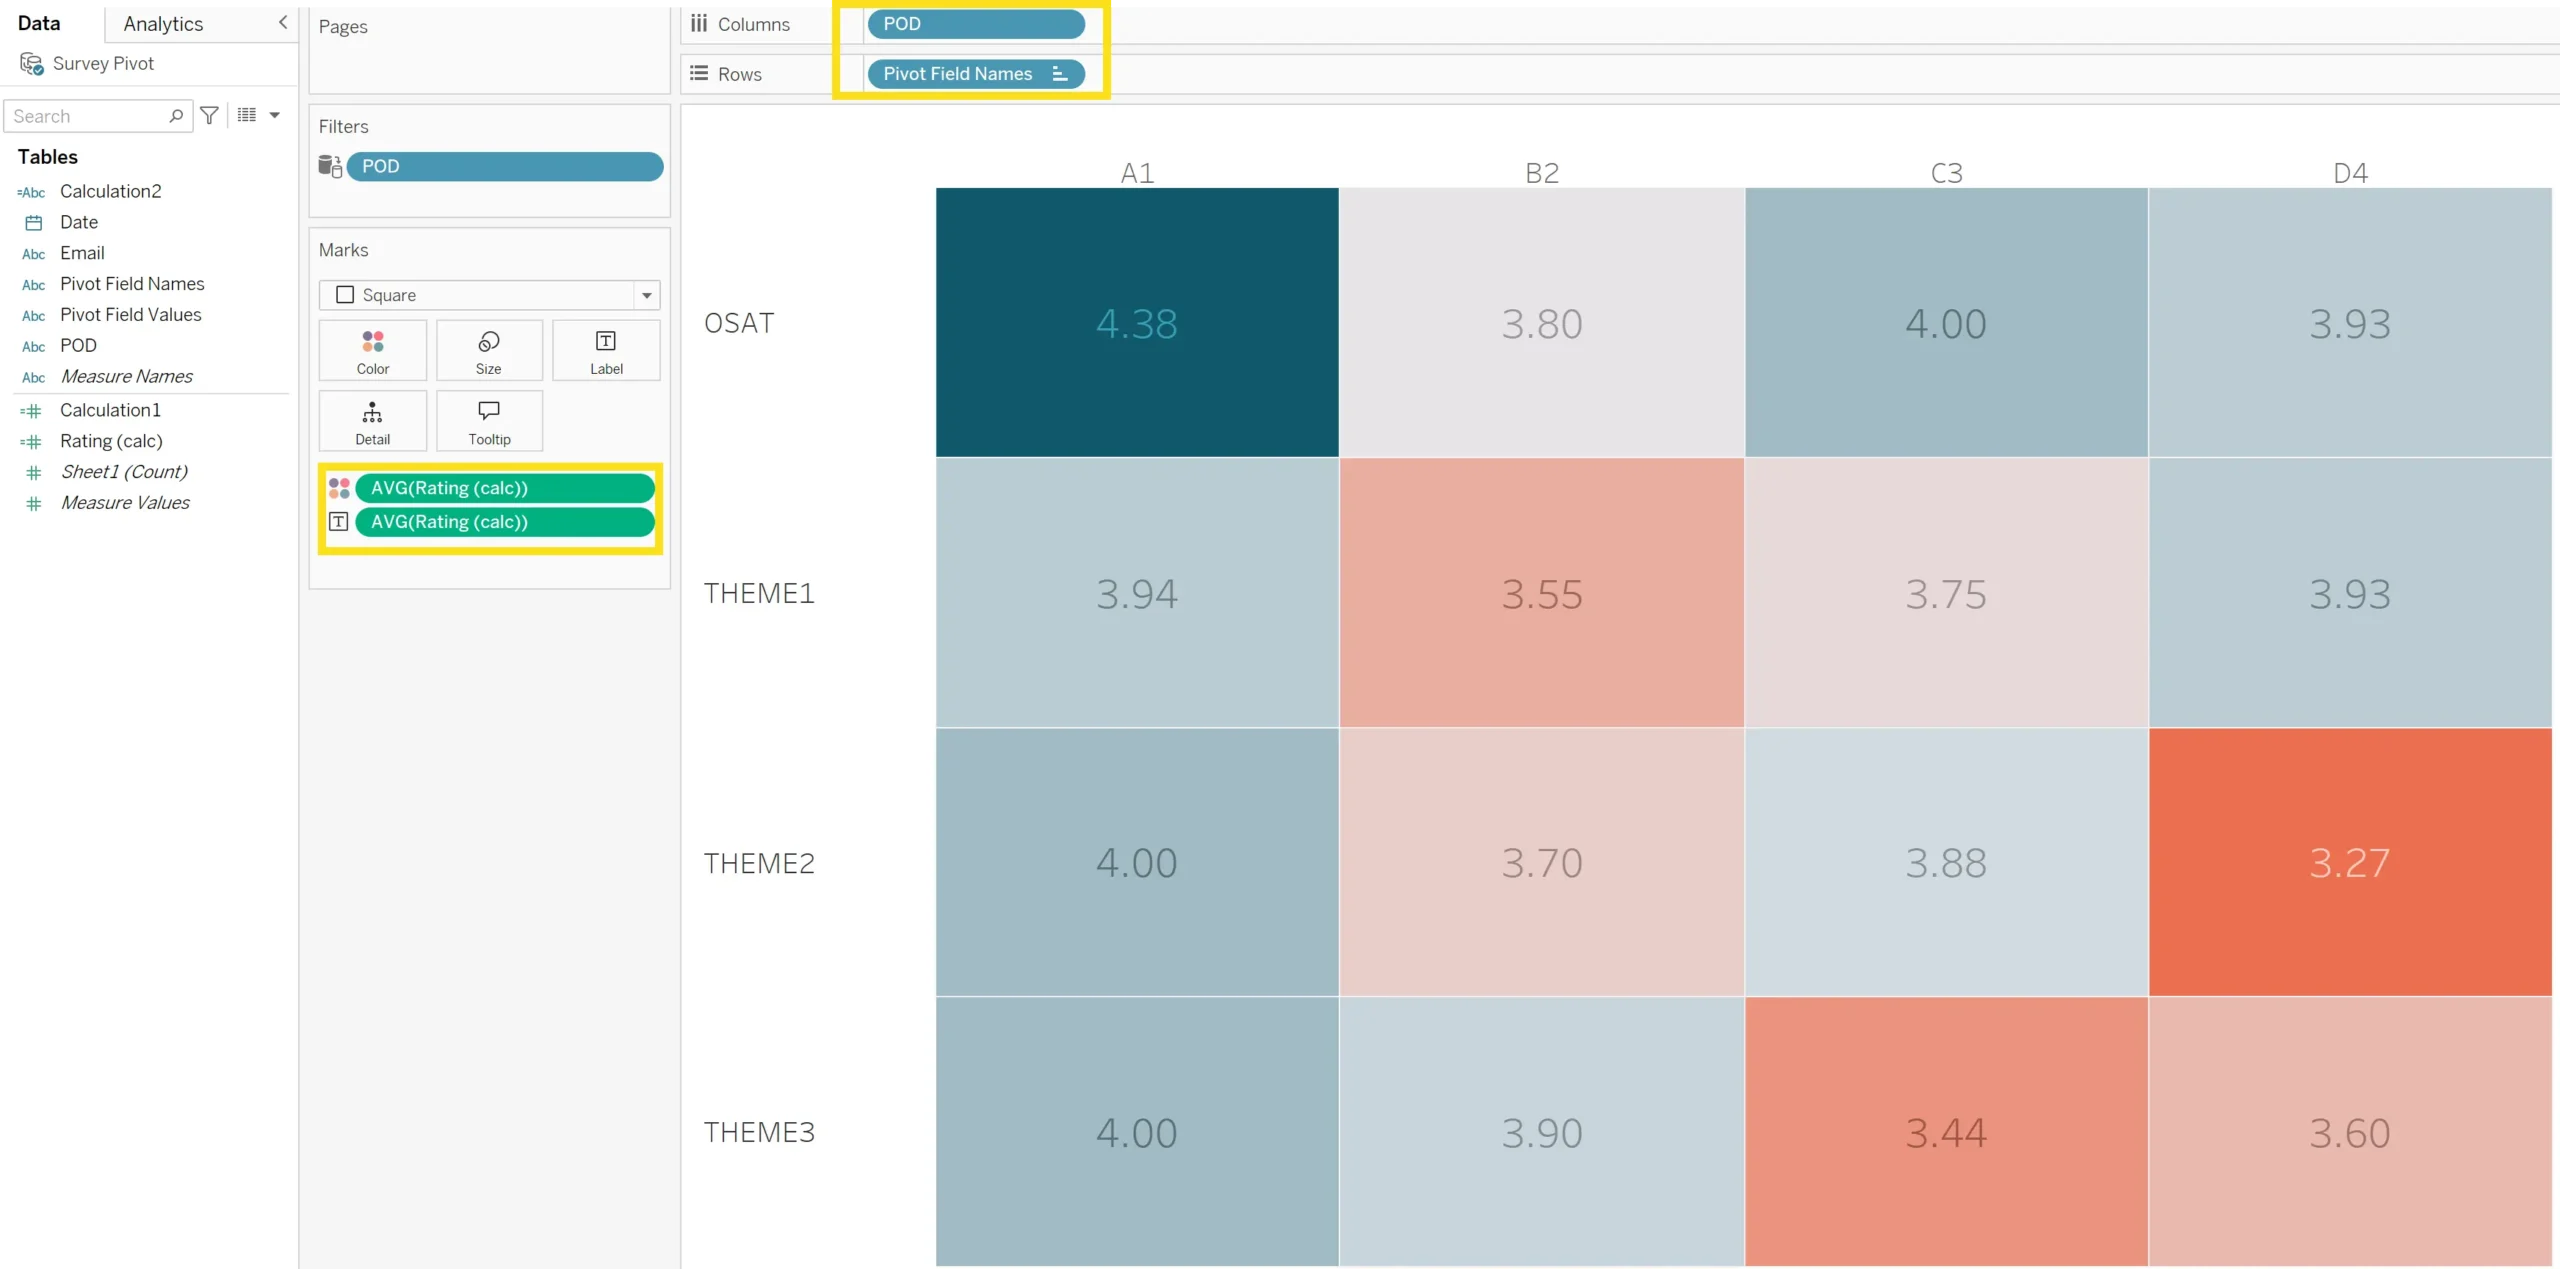
This is similar to the output on Google sheet, but with much better aesthetics and the flexibility to add more details as needed.
First, add the ‘Pivot Field Names’ dimension to the Columns shelf and the ‘POD’ dimension to the Rows shelf.
Next, drag ‘Rating (calc)’ to the Marks card and drop it on ‘Color’. Change the measure to ‘Average’.
Duplicate the above field and drag it on ‘Label’.
Quick tip: to duplicate a field, drag the field while pressing Ctrl (or CMD on Mac).
Finally, adjust the colors, borders, and sizing to enhance readability, based on your preferences.
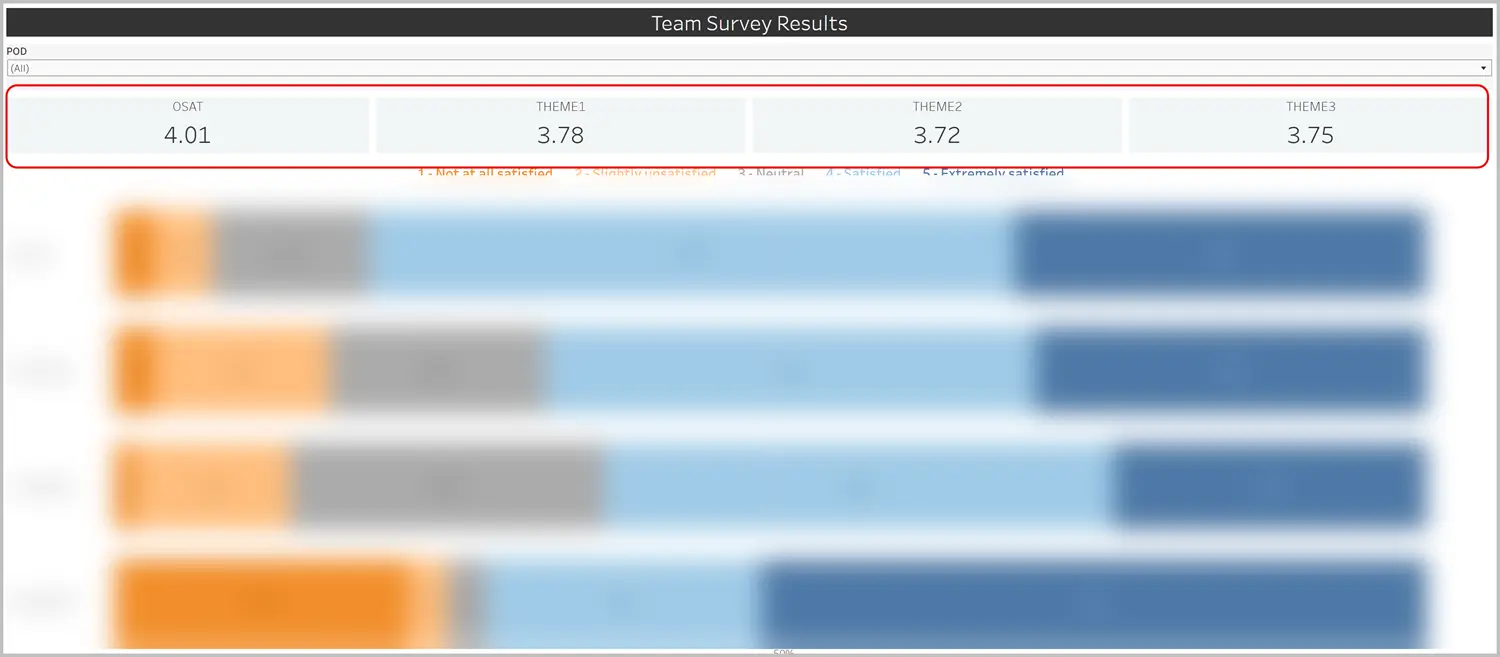
Step 2b: Create Individual Tiles for Each Score
Duplicate the previous sheet by right-clicking the sheet tab and selecting Duplicate.
Remove ‘POD’ from the Columns shelf.
Remove ‘AVG(Rating (calc))’ from the Color shelf.
Add ‘Pivot Field Names’ to the Filters shelf and select one of the four field names. This will filter the sheet to display only that specific field name and its corresponding values.
Repeat this process for the remaining three field names by duplicating the sheet again for each one.
These individual sheets can then be placed on the dashboard as tiles to display the overall scores for each field.
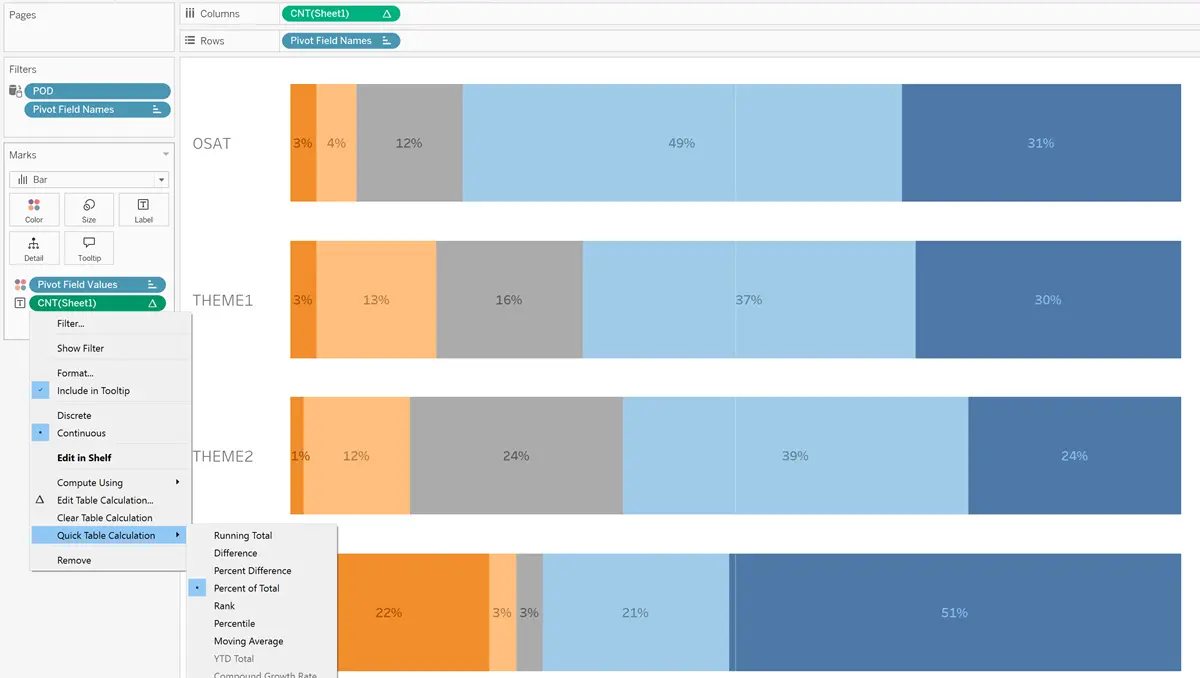
Step 3: Create the Likert Chart
Start by adding the count of responses (‘CNT(Sheet1)’) to the Columns shelf and ‘Pivot Field Names’ to the Rows shelf.
Next, modify the calculation for ‘CNT(Sheet1)’ to ‘Percent of Total’. To do this, click the downward arrow on the ‘CNT(Sheet1)’ field, select Quick Table Calculation, and choose ‘Percent of Total’. Make sure it’s computed using Table (across).
Drag ‘Pivot Field Values’ to the Marks card and drop it on Color. Then, duplicate the column field and add it to Label in the Marks card.
To add a reference line at 50%, go to Analytics -> Reference Line, select Custom and set the value to 0.5.
Adjust the colors and sizes for improved readability.
Formatting Hacks I Used
Some of the formatting and aesthetic tweaks required a bit of extra effort. With the help of the Tableau community and a few other resources, I managed to make the changes I wanted. Here are a few key tricks I’m noting for future reference:
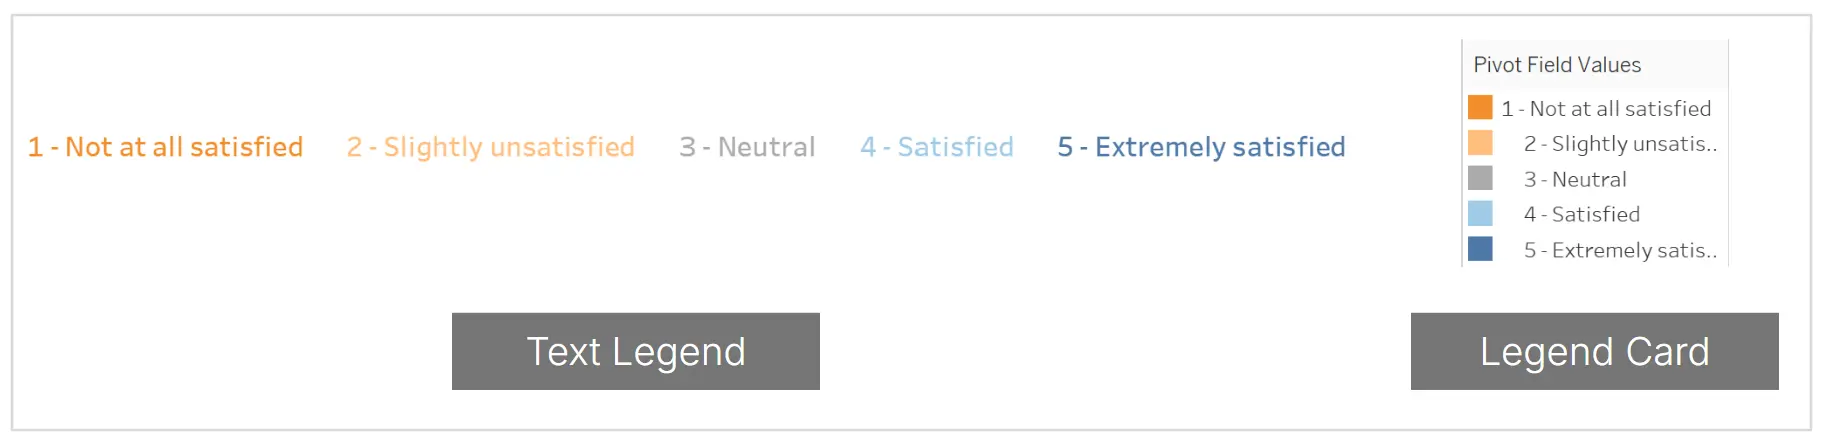
a) Placing the color legend as text above the chart instead of using the default legend card
To do this, I created a separate sheet and added ‘Pivot Field Values’ to the Marks card as both Color and Text. I then placed this sheet above the Likert chart on the dashboard, making it appear as a text legend. While Tableau automatically generates a default color legend, I found this method more visually appealing. (Thanks to this article for the inspiration.)
b) Adding spacing between legend values for better readability
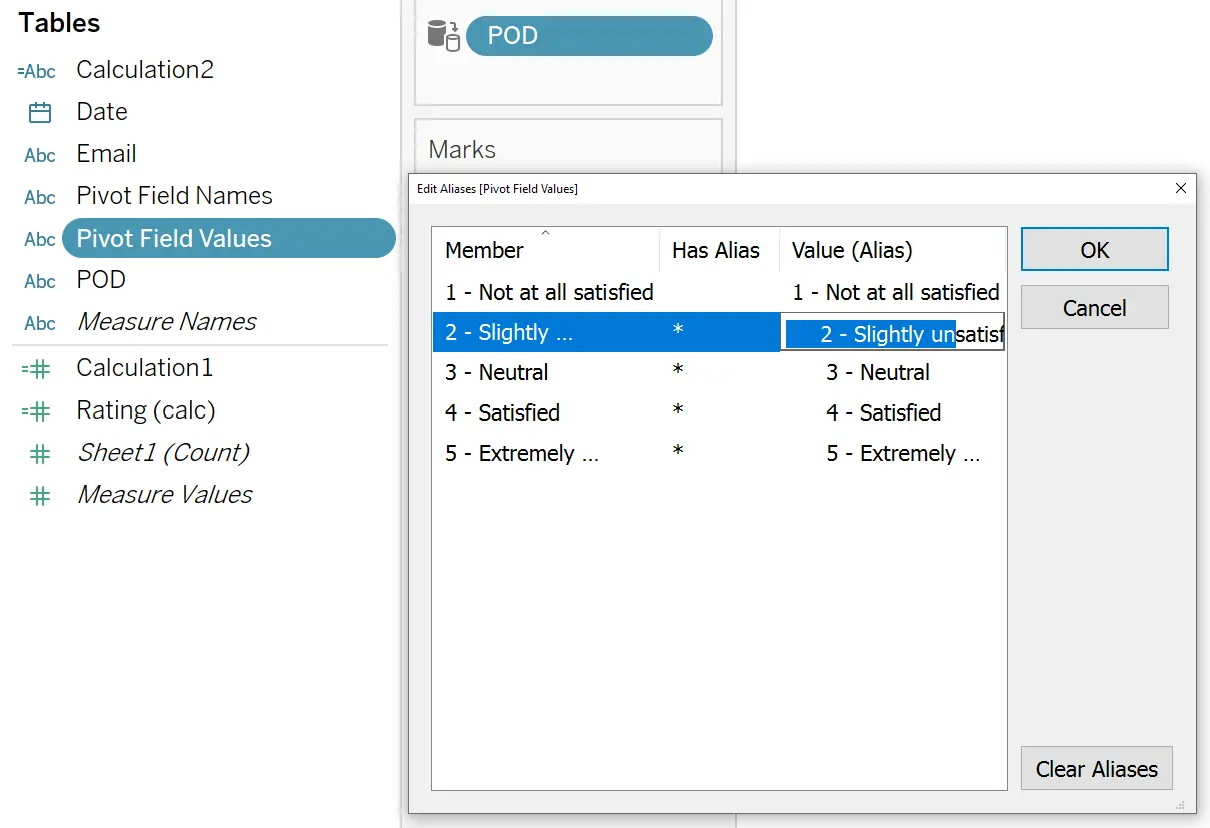
While I was able to add the text legend as described above, the values were too close to each other. There is no option to increase the spacing between words in Tableau. So, as a workaround I edited the alias of the ‘Pivot Field Values’ (right click on ‘pivot field values’ in the data shelf and select ‘Aliases’), adding a few blank spaces before the text to increase the spacing.
c) Moving the text legend to the center of the dashboard
By default, the newly created legend was left-aligned, and I couldn’t center it through the Format pane (I wonder why!). As a workaround, I created a calculated field with a blank value, added it to the Rows shelf, and repeated it several times until the legend was centered properly. (Thanks to the answer from Ganapathy in the Tableau community.)

And there you have it—a simple way to visualize stakeholder feedback.
I’m sure there must be much better ways to approach this, so please feel free to share your thoughts!
Thanks for reading! I’d love to hear your thoughts in the comments below. If you found this useful, please share it with anyone who might benefit from it.
Want to stay in the loop?
To get notified when I publish my next article, you can subscribe to my newsletter here. I send an email every few weeks when I publish something new – just links to articles I’ve written, and occasionally, books or articles I found worth reading.
Photo Credit
- Feature Image: Photo credit: Isaac Smith on Unsplash